The goal of resourcecode is to provide an easy access to the Resourcecode hindcast database of sea-states. More information on the database can be found here. This website only contains information about the way to retrieve data from this data base and the functionalities offred by this package.
Installation
The resourcecode package is on CRAN so you can simply run :
install.packages("resourcecode")You can install the development version of resourcecode thanks to r-universe:
install.packages("resourcecode",
  repos = c(
    "https://resourcecode-project.r-universe.dev",
    "https://cloud.r-project.org"
  )
)
or using the classical:
devtools::install_github("Resourcecode-project/r-resourcecode")This package depends on data in a data package resourcecodedata that is available on CRAN on will be installed when installing the package for the first time.
Examples
Plot the bathymetry used in the project
library(resourcecode)
library(resourcecodedata)
resourcecode::rscd_mapplot(rscd_field$depth, name = "Depth (m)", transform = "sqrt")
See the variables available in the database:
head(rscd_variables)
#>        name         longname         unit
#> 1 longitude        longitude  degree_east
#> 2  latitude         latitude degree_north
#> 3       tri              tri
#> 4    MAPSTA       status map            1
#> 5       dpt            depth            m
#> 6      ucur eastward current        m s-1
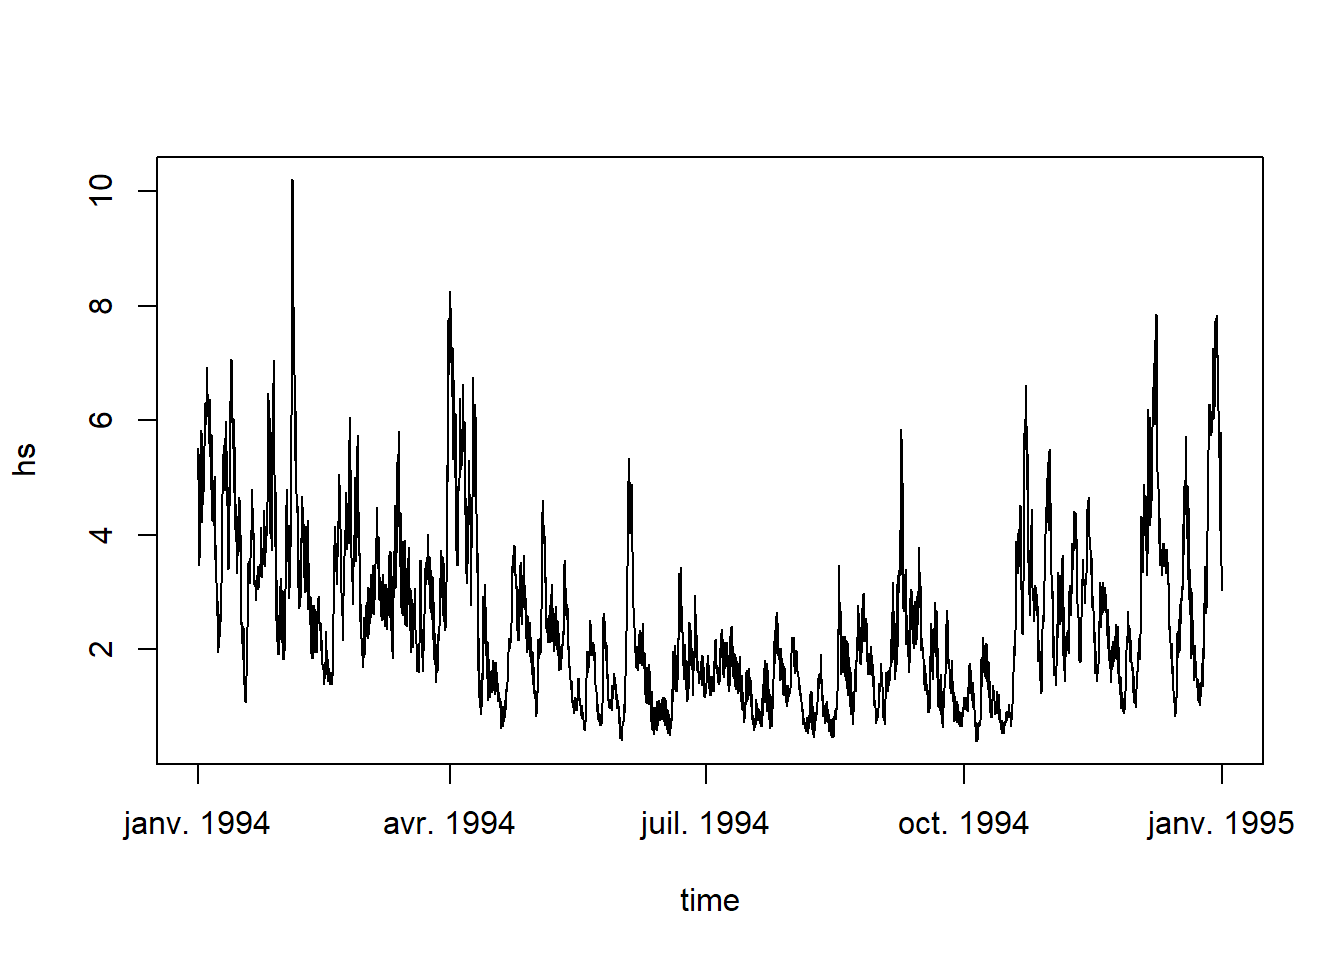
Download a time series of significant wave height next to the coast of Finistère:
data <- get_parameters(node = "134865", parameters = "hs")
str(data)
#> tibble [8,760 × 2] (S3: tbl_df/tbl/data.frame)
#>  $ time: POSIXct[1:8760], format: "1994-01-01 00:00:00" "1994-01-01 01:00:00" ...
#>  $ hs  : num [1:8760] 4.82 4.98 5.19 5.37 5.48 ...
#>  - attr(*, "node")= num 134864
plot(data, type = "l")
