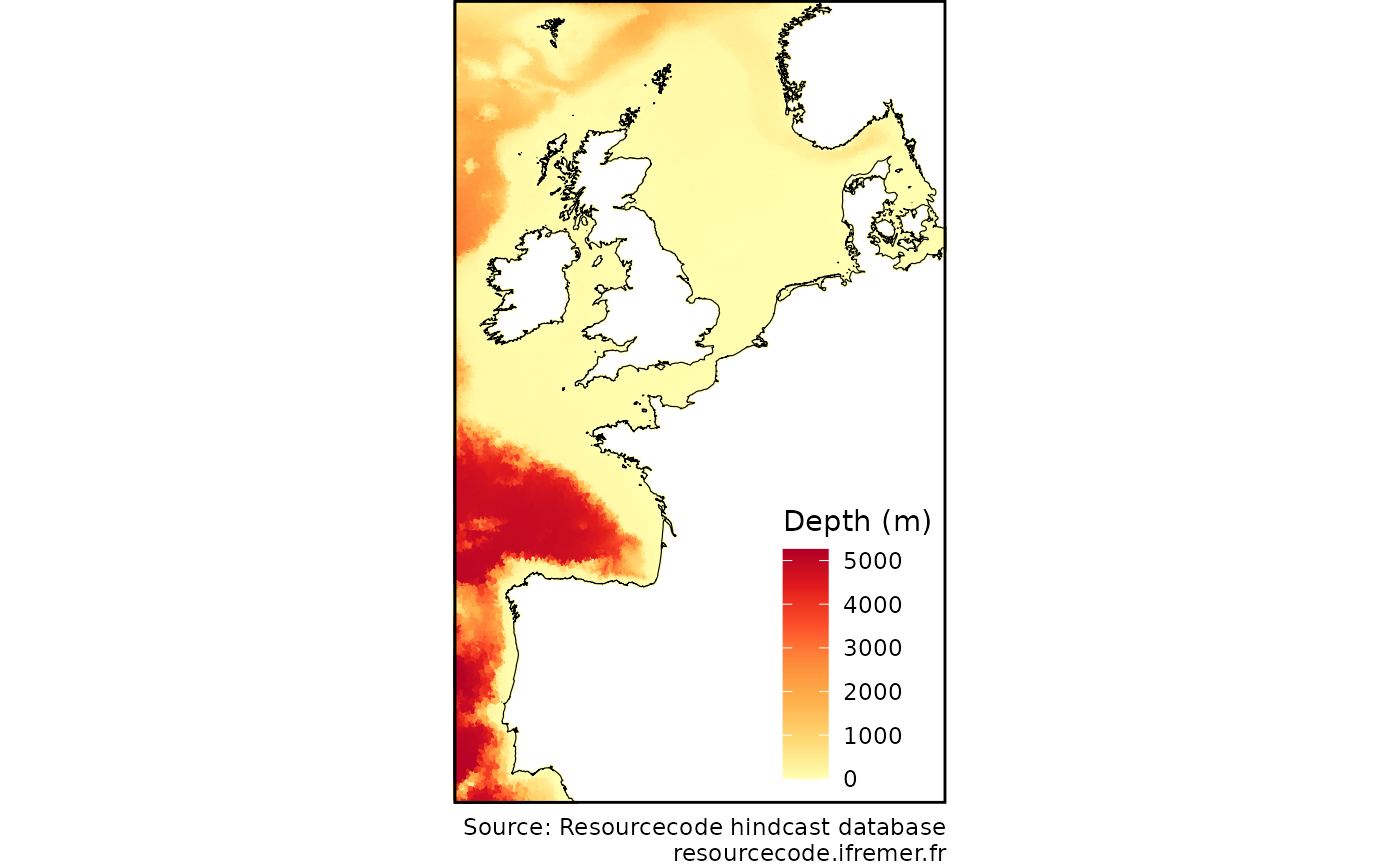
Create a map of the provided variable on the RESOURCECODE field grid
Source:R/plots.R
rscd_mapplot.RdCreate a map of the provided variable on the RESOURCECODE field grid
Usage
rscd_mapplot(
  z,
  name = "Depth (m)",
  zlim = NULL,
  palette = "YlOrRd",
  direction = 1,
  transform = "identity"
)
Arguments
- z
the data ro plot: a vector of the same size as the grid (328,030 rows).
- name
name of the variable plored, to be included in the legend.
- zlim
limits of the scale. See
continuous_scalefor details.- palette
If a string, will use that named palette. See
scale_colour_brewerfor other options.- direction
Sets the order of colours in the scale. See
scale_colour_brewerfor details.- transform
Transformation to apply to the color scale. See
continuous_scalefor details.
Examples
rscd_mapplot(resourcecodedata::rscd_field$depth)
