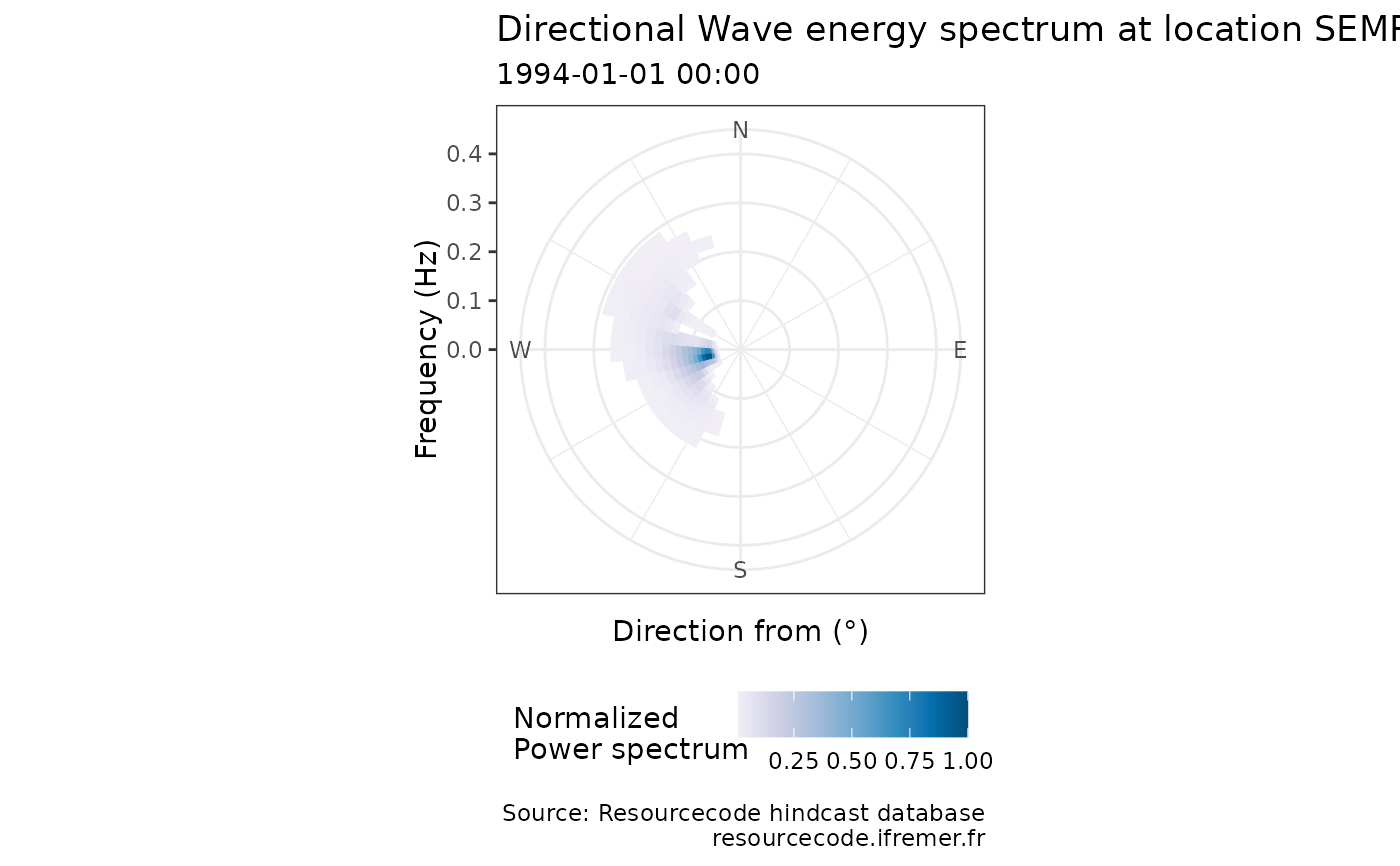
Plot a wave density 2D spectrum
Arguments
- spec
the spectral data, as an output from
get_2Dspectrum- time
the time to plot. Either an integer or the date.
- normalize
Should the spectrum be normalized to have maximum 1 before plotting
- trim
removes the values of the spectral density lower than this value
- cut_off
cut-off frequency above which the spectrum is not plotted
- ...
currently unused
Examples
plot_2d_specta(resourcecodedata::rscd_2d_spectra, 1)