R/specta_data_ploting.R
plot_1d_specta.Rd
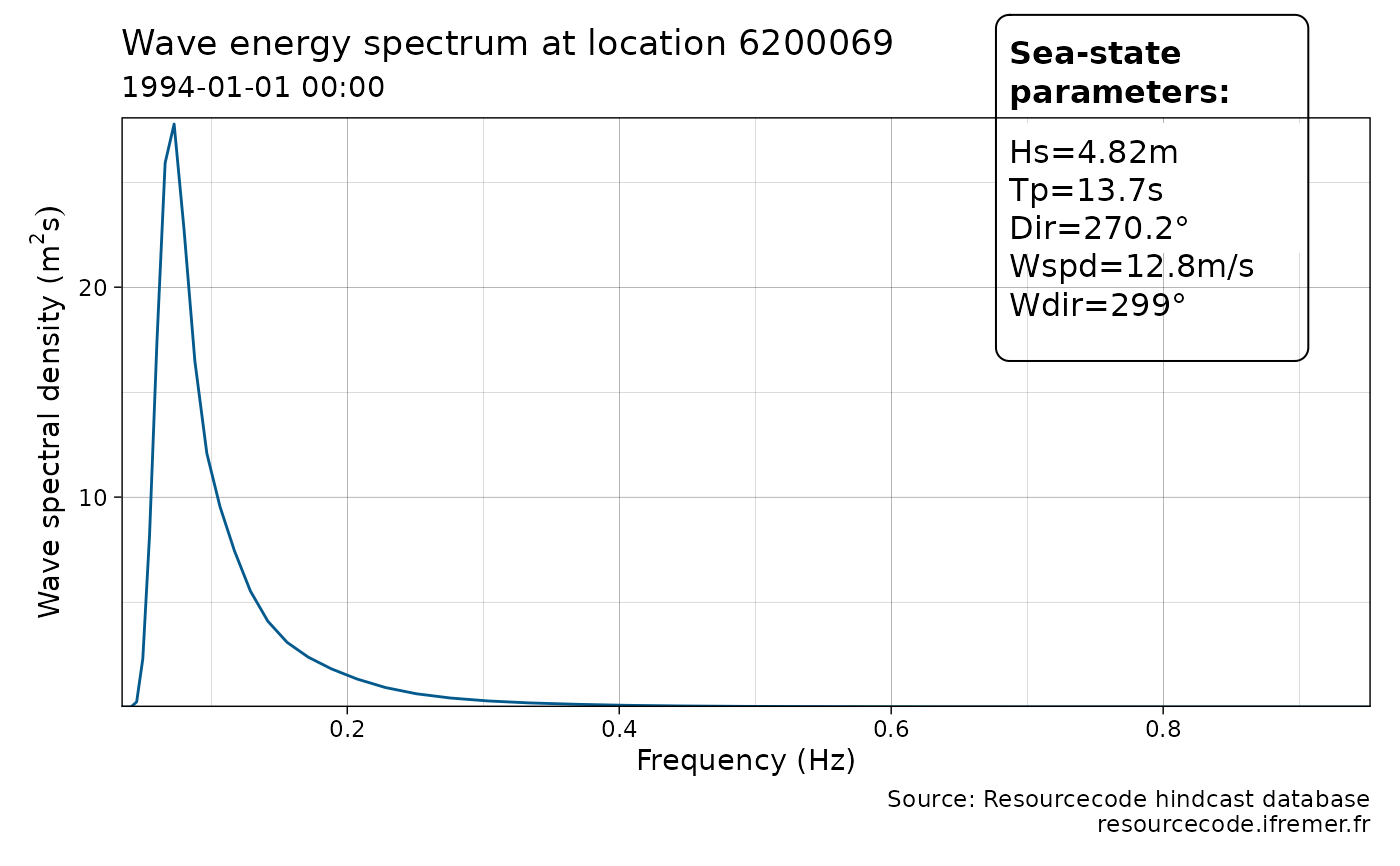
Plot a wave density 1D spectrum at a given time
plot_1d_specta(spec, time = 1L, print_sea_state = TRUE, ...)
the spectral data, as an output from get_2Dspectrum
get_2Dspectrum
the time to plot. Either an integer or the date.
should the sea_states parameters being plot ? Default to TRUE.
currently unused
a ggplot object
plot_1d_specta(resourcecodedata::rscd_1d_spectra, 1)