Download the 1D spectrum data from IFREMER ftp
Source:R/spectral_data_download.R
get_1d_spectrum.RdDownload the 1D spectrum data from IFREMER ftp
Value
A list with 12 elements:
- longitude
Longitude
- latitude
Latitude
- frequency1
Lower frequency
- frequency2
Upper frequency
- ef
Surface elevation variance spectral density
- th1m
Mean direction from first spectral moment
- th2m
Mean direction from second spectral moment
- sth1m
Mean directional spreading from first spectral moment
- sth2m
Mean directional spreading from second spectral moment
- freq
Central frequency
- forcings
A data.frame with 14 variables:
- time
Time
- dpt
Depth, positive downward
- wnd
Wind intensity, at 10m above sea level
- wnddir
Wind direction, comes from
- cur
Current intensity, at the surface
- curdir
Current direction, going to
- hs
Significant wave height
- fp
Peak wave frequency
- f02
Mean wave frequency
- f0m1
Mean wave frequency at spectral moment minus one
- th1p
Mean wave direction at spectral peak
- sth1p
Directional spreading at spectral peak
- dir
Mean wave direction
- spr
Mean directional spreading
- station
Station name
Examples
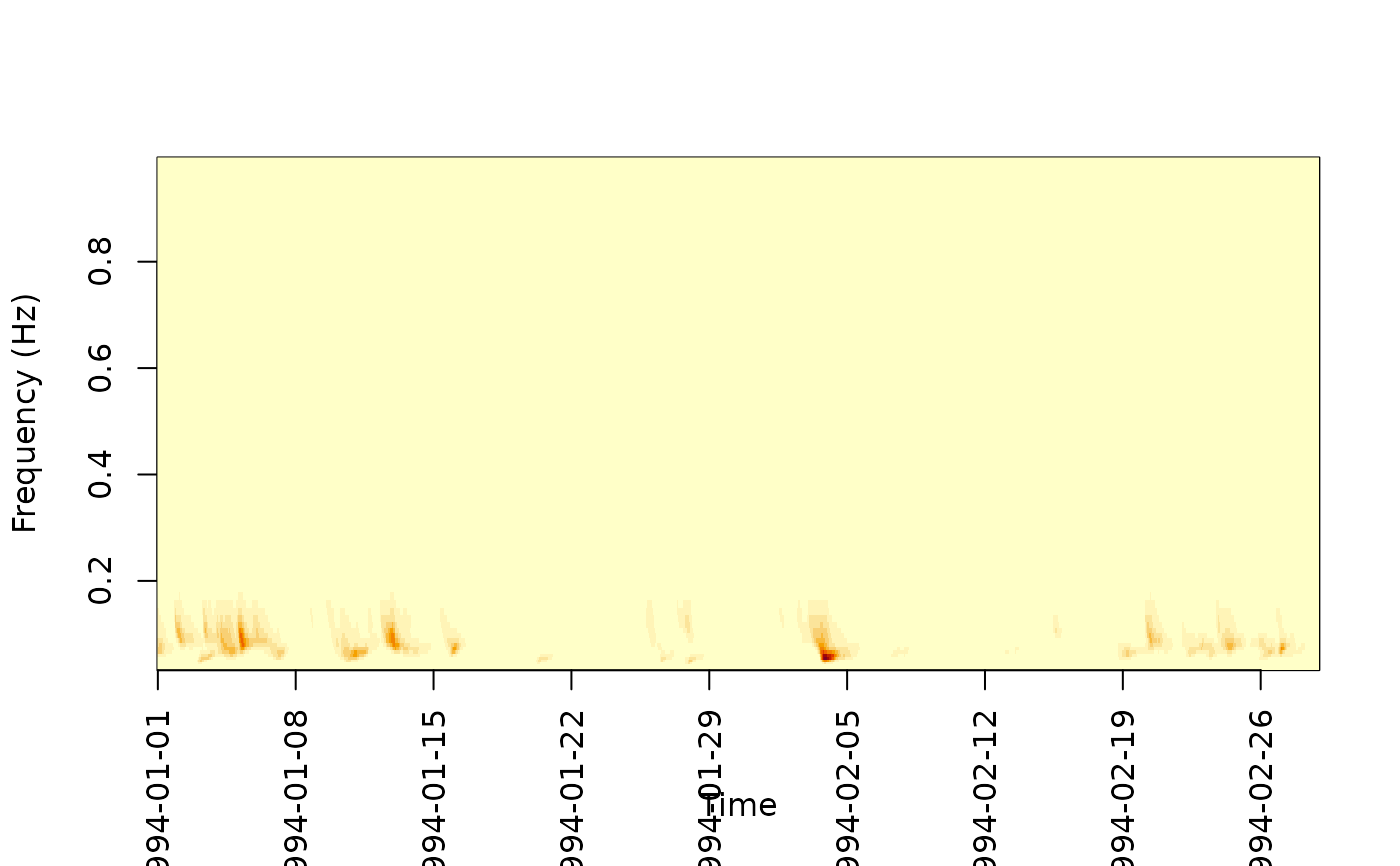
spec1D <- get_1d_spectrum("SEMREVO", start = "1994-01-01", end = "1994-02-28")
r <- as.POSIXct(round(range(spec1D$forcings$time), "month"))
image(spec1D$forcings$time, spec1D$freq, t(spec1D$ef),
  xaxt = "n", xlab = "Time",
  ylab = "Frequency (Hz)"
)
axis.POSIXct(1, spec1D$forcings$time,
  at = seq(r[1], r[2], by = "week"),
  format = "%Y-%m-%d", las = 2
)
